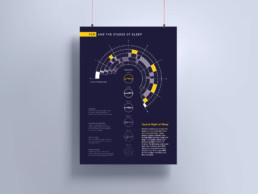
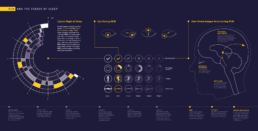
REM and the Stages of Sleep
Data Visualization / Infographic
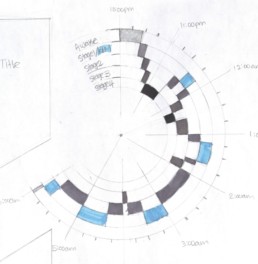
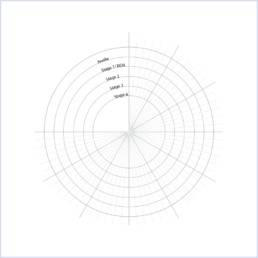
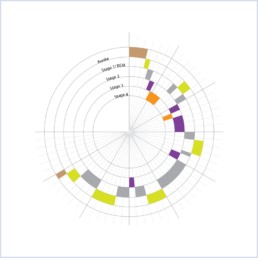
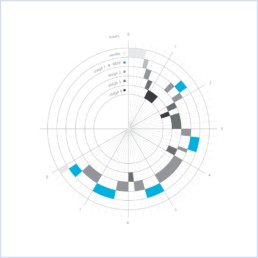
How can we visualize the patterns of our sleep cycle?
By translating data and findings from studies into a visually engaging graph that’s easier to digest.
Project
Coursework
Role
Graphic Designer
Tools
Adobe Creative Suite
Date
2016
